Kubernetes Horizintal Pod Autoscaler (HPA) supports automatically scale the number of pods in a replication controller, deployment or replica set based on custom metrics. Kublr monitoring system provides metrics services for HPA.
You can see autoscaling algorithm at the link: https://github.com/kubernetes/design-proposals-archive/blob/main/autoscaling/horizontal-pod-autoscaler.md#autoscaling-algorithm
After calculating new replica counts, some pods marks for delete.
Pod termination process (https://kubernetes.io/docs/concepts/workloads/pods/pod/#termination-of-pods):
Parameters defines in Kublr custom-specifiacation on cluster create procedure or in /etc/kublr/daemon.yaml file on master node and in CloudFormation template.
In Kublr monitoring system implemented metrics server for HPA.
Go to the Cluster’s page and click the Add Cluster button.

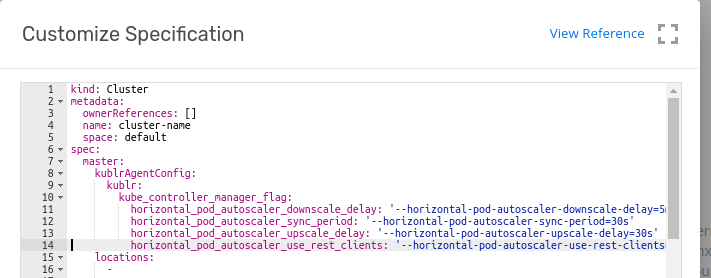
kind: Cluster
metadata:
  ownerReferences: []
  name: cluster-with-hpa
  space: default
spec:
  master:
    kublrAgentConfig:
      kublr:
        kube_controller_manager_flag:
          horizontal_pod_autoscaler_downscale_delay: '--horizontal-pod-autoscaler-downscale-delay=5m30s'
          horizontal_pod_autoscaler_sync_period: '--horizontal-pod-autoscaler-sync-period=30s'
          horizontal_pod_autoscaler_upscale_delay: '--horizontal-pod-autoscaler-upscale-delay=30s'
...
Kind: Cluster
metadata:
ownerReferences: []
name: cluster-with-hpa
space: default
spec:
...
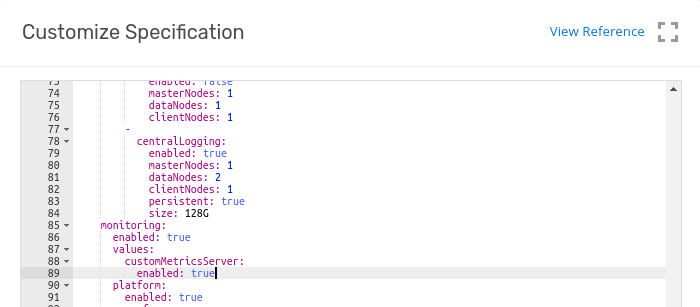
features:
monitoring:
enabled: true
values:
customMetricsServer:
enabled: true
...
To demonstrate a HorizontalPodAutoscaler, you will first start a Deployment that runs a container using the hpa-example image, and expose it as a Service using the following manifest. To do so, run the following command:
$ kubectl apply -f https://k8s.io/examples/application/php-apache.yaml
Now that the server is running, we will create the autoscaler using kubectl autoscale.
$ kubectl autoscale deployment php-apache --cpu-percent=50 --min=1 --max=10
We may check the current status of autoscaler by running:
$ kubectl get hpa
NAME         REFERENCE                     TARGET    MINPODS   MAXPODS   REPLICAS   AGE
php-apache   Deployment/php-apache/scale   0% / 50%  1         10        1          18s
Now, we will see how the autoscaler reacts to increased load. We will start a container, and send an infinite loop of queries to the php-apache service (please run it in a different terminal):
$ kubectl run -i --tty load-generator --image=busybox /bin/sh
Hit enter for command prompt $ while true; do wget -q -O- http://php-apache.default.svc.cluster.local; done Within a minute or so, we should see the higher CPU load by executing:
$ kubectl get hpa
NAME         REFERENCE                     TARGET      CURRENT   MINPODS   MAXPODS   REPLICAS   AGE
php-apache   Deployment/php-apache/scale   305% / 50%  305%      1         10        1          3m
Here, CPU consumption has increased to 305% of the request. As a result, the deployment was resized to 7 replicas:
$ kubectl get deployment php-apache
NAME         DESIRED   CURRENT   UP-TO-DATE   AVAILABLE   AGE
php-apache   7         7         7            7           19m
We will finish our example by stopping the user load.
In the terminal where we created the container with busybox image, terminate the load generation by typing
Then we will verify the result state (after a minute or so):
$ kubectl get hpa
NAME         REFERENCE                     TARGET       MINPODS   MAXPODS   REPLICAS   AGE
php-apache   Deployment/php-apache/scale   0% / 50%     1         10        1          11m

$ kubectl get deployment php-apache
NAME         DESIRED   CURRENT   UP-TO-DATE   AVAILABLE   AGE
php-apache   1         1         1            1           27m
Here CPU utilization dropped to 0, and so HPA autoscaled the number of replicas back down to 1.
In some cases manual checks custom metric API requires. To do that please use next rules and examples:
kubectl get --raw "/apis/custom.metrics.k8s.io/v1beta1/namespaces/default/pods/*/phpfpm_active_processes/"
or
kubectl get --raw "/apis/custom.metrics.k8s.io/v1beta1/namespaces/kube-system/pods/*/rabbitmq_queue_messages/" | jq .
To retrieve the given metric for the given non-namespaced object (e.g. Node, PersistentVolume):
/{object-type}/{object-name}/{metric-name...}
To retrieve the given metric for all non-namespaced objects of the given type:
/{object-type}/*/{metric-name...}
To retrieve the given metric for all non-namespaced objects of the given type matching the given label selector:
/{object-type}/*/{metric-name...}?labelSelector=foo
To retrieve the given metric for the given namespaced object:
/namespaces/{namespace-name}/{object-type}/{object-name}/{metric-name...}
To retrieve the given metric for all namespaced objects of the given type:
/namespaces/{namespace-name}/{object-type}/*/{metric-name...}
To retrieve the given metric for all namespaced objects of the given type matching the given label selector:
/namespaces/{namespace-name}/{object-type}/*/{metric-name...}?labelSelector=foo
To retrieve the given metric which describes the given namespace:
/namespaces/{namespace-name}/metrics/{metric-name}
https://kubernetes.io/docs/tasks/run-application/horizontal-pod-autoscale/ https://github.com/kubernetes/autoscaler/blob/master/cluster-autoscaler/FAQ.md https://github.com/kubernetes/autoscaler/blob/master/cluster-autoscaler/proposals/metrics.md https://github.com/kubernetes/autoscaler/blob/master/cluster-autoscaler/cloudprovider/aws/README.md https://kubernetes.io/docs/tasks/run-application/horizontal-pod-autoscale-walkthrough/
